
How do you define success? Maybe it’s something monetary, maybe it’s by being recognized as the expert, or maybe it’s by the numbers of people who follow or subscribe to you. For me, success can be defined as a combination of these, but what I find incredibly interesting and important at this moment is how people spread the word about the story you’re telling. On July 4th, 2016 I started amping up Abernathy’s social media presence by increasing the number of posts across all of our channels: Twitter, Facebook, LinkedIn and Google+.
I researched what other companies and bloggers do to increase their audience and engagement, and through my research I was able to implement the tools these marketers used by using Buffer, without spending any extra money.
There are companies like Meet Edgar, which for a small fee, provide a simple solution to automate blog posts, or in this case, articles. But I wanted to see if I could mimic what they do, to see in fact if this actually increased engagement.
Spoiler: it does.
Here’s why putting in a little bit of effort and time in scheduling posts on social media makes sense and is worth the investment (time or money) if you’re measuring engagement and growth.
Over the course of 28 days, the insight that Facebook calculates for our page shows that we saw increases in every category. Our page views increased by 95% and likes increased by 35%. The number of people our articles reached plus those who liked, commented and shared them increased by 94%, and the number of times people engaged with our posts (by sharing, commenting and liking) increased by 236%. One of the biggest takeaways from looking at the data on Facebook was seeing the number of times a fan clicked on our contact info and sign-up (call-to-action) button - this increased by 400%!
Our tweets went up 337% from the previous 28 day period, 236,000 users saw our tweets (up 171% from the previous period) and our profile visits went up 46%.
Our team uses Slack and we have integrations that notify us when someone either subscribes to our newsletter or mentions us on twitter. Although we see these notifications daily, it wasn’t until I crunched the numbers that I saw these subtle, yet consistent notifications actually added up.
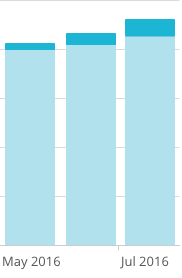
mailchimp subscribers
The newsletter campaign we sent a few days after this experiment started garnered the biggest increase in both open rate and click rate at 34% and 9.5% respectively (industry average open rate is 14.8% and 1.7% click rate). Our total subscribers increased by 80% from the previous period.
So more eyeballs are on social media and more people see our articles in their inboxes -- which is great -- but what about traffic to our actual website?
I tuned in to Google Analytics which did all the number crunching for me, and what is unsurprising, yet worth noting is that our page views went up 27% from the previous 28 day period, and the period of time a user is actively engaged with our website went up 31%. The majority of people (71%) who come to our site have never seen us before, and this is a major 🔑 in determining how we create future marketing campaigns.
Aside from numerical data which can often be great to gauge a variety of insights; content and context also matters.
So, what else happened during this time span?
Well, the tragic murders of Philando Castile and Alton Sterling (and the murders of the police officers in Dallas and Baton Rouge) may have contributed to an increase in engagement and traffic in July.
Our platform provides a space where anyone can voice their opinions on issues that affect them. The irony of these events is that Abernathy was created primarily because our founder was fed up at the images mainstream media portrays black men. On July 8th, we published an article titled White People: Understand That We Don’t Understand which was our top post on Facebook, and where we saw the biggest spike in reach the day the article was published -- which also trickled in to the next day.
Although Abernathy is not intended to be a “hot takes” media platform, we are thoughtful when we publish timely pieces like the one mentioned above. Our audience responds to unbiased opinions, and a similar effect happened on twitter. But What About Black on Black Crime (which was originally published on March 9th, 2015) was the top engaged post. 29.5% of users who saw this post either clicked, retweeted, replied, followed us and/or liked this post. Content matters.
Thankfully there are geniuses behind each of these platforms that are able to crunch these numbers for us. It’s worth the research and time to schedule these posts (or use tools to do this for you) in order to understand what these numbers mean.
This can provide insight on how to create strategies to help you achieve whatever success means to you. If it’s monetary, you can determine how much you want to spend on paid advertising on sites. If it’s engagement, you can determine what type of content you want to publish and which platform to do so. In addition to this, what these numbers tell me is that the stories we publish are being spread at an increasingly, steady and organic rate.
As long as our audience keeps growing bit by bit, and with the help of our contributors and sponsors, we’ll be able to live up to our mission.